Custom Indicator ~ Tutorial for Forex Trading
Custom Indicator, Custom Forex Indicators, Custom Forex Indicator Programming are the topics of this Tutorial for Forex Trading. We guide you how to make custom indicator, custom Forex indicators.
Tutorial for Forex Trading is one of Fintechee’s free services. We help traders learn how to trade Forex by using our WEB Trader or Expert Advisor Studio. The contents here will not be limited to the field of Forex. Any instrument of investment will be discussed.
Custom Indicator Tutorial Video
Description
This tutorial is about the Custom Indicator architecture of our WEB Trader. Custom indicator is very important to analyze market movements. By reading this tutorial for Forex trading, traders can learn how to code their own custom indicators. It’s a little bit difficult for non-technicians and it’s usually used by advanced traders. So we applied fewer object-oriented programming skills to make it easier for beginners.
An Alternative to Candlestick
Hello everybody, today let’s talk about “Custom Indicator”.
First of all, Please open our home page and then click the “WEB TRADER” button to access our demo and you will be led to our WEB Trader. This is the basis of this tutorial for Forex trading.
As we know, the market movements are always so complicated that the information contained by the candlesticks is not that enough to help us analyze. We need more informative instruments. Maybe someone would say that we can use Fibonacci as well. Yes, they are correct. Some masters have introduced Fibonacci retracements, Elliott waves, Chaos theory to us(this tutorial for Forex trading won’t expand). We have read many stories that some traders earned millions of money by applying these practices. But there is one thing I hope you to be careful: this kind of technical skill is based on some theory that is a little subjective. You may not identify the patterns of the markets by Fibonacci retracements or Elliott waves. Whether it works or not depends on the abilities of traders. Only professional traders can master this kind of skill. For beginners, it’s too difficult. Sometimes Fibonacci retracements or Elliott waves help us get profit, sometimes they make us get a loss.
We need more intuitive instruments. Indicators are flexible, informative. Only several values can contain more information. The most important thing is that we can read the values from the chart straightforward, so it’s more intuitive than Fibonacci retracements and more informative than candlesticks’ values. So it comes up to us to be a better alternative to help us analyze the market movements.
Traditional Trading Platforms Support Custom Indicator
Indicators are intuitive and we can read the values from the charts straightforward, but coding is a different story.
A lot of traditional trading platforms(this tutorial for Forex trading won’t expand) have provided us with their features that support traders to code their own custom indicators. If the regular indicators don’t meet our requirements, we can code our own custom indicator. But coding is a complex and professional work. Sometimes we need to download some specific plugins or extensions to support our specific programming languages. Most of the time, installation is required. That means we need to bring a PC with us anywhere in order to enjoy the helpful instruments meantime. It’s not convenient at all.
Our WEB Trader is a Better Choice to Code Custom Indicator
Our WEB Trader makes everything simpler. You needn’t download any software or install any plugin. Because our Forex trading platform is WEB-based, you can code your own custom indicators on the WEB page straightforward. You can run them and check the results straightforward on the WEB page as well.
Let’s start learning how to code our own custom indicator on our WEB Trader.
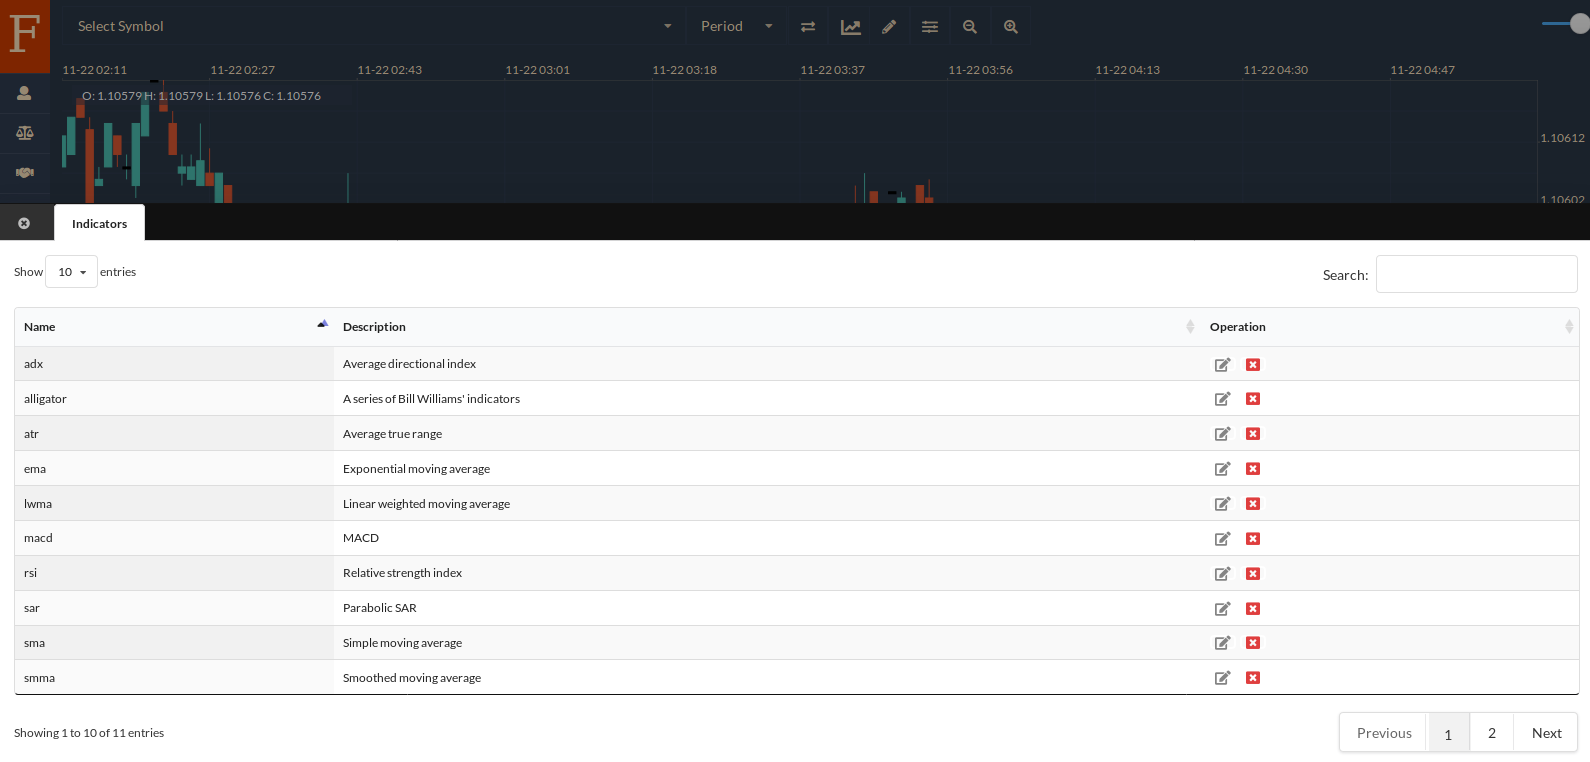
Our WEB Trader provides many built-in indicators. Please click the “Arrow” icon on the menu bar on the left, a panel listing many indicators will show up. They are built-in indicators. You can edit the source codes attached to the built-in indicators and customize them. Please note that the built-in source codes will override the revised versions by the WEB Trader automatically when you reload the WEB Trader. Therefore, before you code your own custom indicator, please first rename the indicators that you are editing, and then code your own program. Otherwise, once the built-in source codes override your revised versions, your revised versions can’t be restored anymore.
We strongly recommend you read our tutorial regarding the basic functions before you practice following this tutorial for Forex trading. In our previous tutorial, we have introduced to you how to check and modify the source codes attached to the built-in indicators. This tutorial for Forex trading won’t expand repeatedly.
We published the source codes of the samples on our GitHub repository and the page - SDK Trading as well. You can check the source codes of the samples there.
Code Your Own Custom Indicator
Let’s start coding. We apply Javascript to code our custom indicators and expert advisors. Javascript is out of the scope of this tutorial for Forex trading. Please refer to other materials before you continue reading, if you are not familiar with Javascript.
Before you code your own custom indicator, you need to learn some constant definitions, they are “broker name”, “time frame”, “order type”, “where to render”, “data name”, “render type”, “parameter type”.
Constant Definition
var BROKER_NAME = {
	DEMO: "CC Demo"
}

var TIME_FRAME = {
	M1: "M1",
	M5: "M5",
	M15: "M15",
	M30: "M30",
	H1: "H1",
	H4: "H4",
	D: "D",
	W: "W",
	M: "M"
}

var ORDER_TYPE = {
	OP_BUY: "BUY",
	OP_SELL: "SELL",
	OP_BUYLIMIT: "BUY LIMIT",
	OP_SELLLIMIT: "SELL LIMIT",
	OP_BUYSTOP: "BUY STOP",
	OP_SELLSTOP: "SELL STOP"
}

var WHERE_TO_RENDER = {
	CHART_WINDOW: "CHART_WINDOW",
	SEPARATE_WINDOW: "SEPARATE_WINDOW"
}

var DATA_NAME = {
	TIME: "Time",
	OPEN: "Open",
	HIGH: "High",
	LOW: "Low",
	CLOSE: "Close",
	HL2: "HL2",
	HLC3: "HLC3",
	HLCC4: "HLCC4"
}

var RENDER_TYPE = {
	HISTOGRAM: "Histogram",
	LINE: "Line",
	ROUND: "Round",
	DASHARRAY: "Dasharray"
}

var PARAMETER_TYPE = {
	INTEGER: "Integer",
	NUMBER: "Number",
	BOOLEAN: "Boolean",
	STRING: "String"
}
We will introduce to you how to use them later. Let’s check the common functions first, they are SMA, EMA, SMMA, LWMA. If you have the experience to use other trading platforms, then you must have remembered that these common functions are applied to build a moving average indicator.
Common Function
function sma (dataInput, dataOutput, calculatedLength, period) {
	var i = calculatedLength

	if (calculatedLength > 0) {
		i--
	} else {
		for (var j = 0; j < period - 1; j++) {
			dataOutput[j] = 0
		}

		i = period - 1
	}

	var sum = 0

	for (var j = i - period + 1; j < i; j++) {
		sum += dataInput[j]
	}

	for (var j = i; j < dataInput.length; j++) {
		sum += dataInput[j]
		dataOutput[j] = sum / period
		sum -= dataInput[j - period + 1]
	}
}

function ema (dataInput, dataOutput, calculatedLength, period) {
	var i = calculatedLength
	var smthFctr = 2.0 / (period + 1)

	if (i == 0) {
		dataOutput[0] = dataInput[0]
		i++
	} else if (i == 1) {
	} else {
		i--
	}

	while (i < dataInput.length) {
		dataOutput[i] = dataInput[i] * smthFctr + dataOutput[i - 1] * (1 - smthFctr)
		i++
	}
}

function smma (dataInput, dataOutput, calculatedLength, period) {
	var i = calculatedLength
	var sum = 0

	if (i > 0) {
		i--
	} else {
		i = period - 1

		for (var j = 1; j < period; j++) {
			dataOutput[i - j] = 0
			sum += dataInput[i - j]
		}

		sum += dataInput[i]
		dataOutput[i] = sum / period
		i++
	}

	while (i < dataInput.length) {
		sum = dataOutput[i - 1] * period - dataOutput[i - 1] + dataInput[i]
		dataOutput[i] = sum / period
		i++
	}
}

function lwma (dataInput, dataOutput, calculatedLength, period) {
	var i = calculatedLength

	if (i > 0) {
		i--
	} else {
		for (var j = 0; j < period - 1; j++) {
			dataOutput[j] = 0
		}

		i = period - 1
	}

	var sum = 0
	var diffsum = 0
	var weight = 0

	for (var j = 1; j < period; j++) {
		sum += dataInput[i - j] * (period - j)
		diffsum += dataInput[i - j]
		weight += j
	}
	weight += period

	while (i < dataInput.length) {
		sum += dataInput[i] * period
		dataOutput[i] = sum / weight
		diffsum += dataInput[i]
		sum -= diffsum
		diffsum -= dataInput[i - period + 1]
		i++
	}
}
“SMA” stands for “simple moving average”, “EMA” stands for “exponent moving average”, “SMMA” stands for “smooth moving average”, and “LWMA” stands for “lightweight moving average”. The logic of each function is different and we will expand them later.
The Structure of a Standard Custom Indicator
Now let’s start learning the structure of a standard custom indicator. If you want to use your own custom indicator, you need to register your indicator first. We provide you with an API to register your indicator: registerIndicator.
registerIndicator("<Indicator's Name>", "<Description>", function (context) {
	var dataInput = getDataInput(context, <Index of the Data Input>)
	var dataOutput = getDataOutput(context, "<Indicator's Name>")
	var period = getIndiParameter(context, "<Parameter's Name, in this case, it's 'period'>")
	var shift = getIndiParameter(context, "<Parameter's Name, in this case, it's 'shift'>")

	var calculatedLength = getCalculatedLength(context)

	sma(dataInput, dataOutput, calculatedLength, period)

	if (shift != null && calculatedLength == 0) {
		setIndiShift(context, "<Data Output's Name, in this case, the name is 'sma'>", shift)
	}
},[{
	name: "<Parameter's Name, in this case, it's 'period'>",
	value: 5,
	required: true,
	type: PARAMETER_TYPE.INTEGER,
	range: [1, 100]
},{
	name: "<Parameter's Name, in this case, it's 'shift'>",
	value: 0,
	required: false,
	type: PARAMETER_TYPE.INTEGER,
	range: [-30, 30]
}],
[{
	name: DATA_NAME.CLOSE, // We use 'close value' of the candlestick.
	index: 0
}],
[{
	name: "<Data Output's Name, in this case, the name is 'sma'>",
	visible: true,
	renderType: RENDER_TYPE.LINE,
	color: "steelblue"
}],
WHERE_TO_RENDER.CHART_WINDOW)
To run it, you need to register your indicator into our WEB Trader. After you register your indicators, you can add your own custom indicator to the charts.
The “registerIndicator” function has several parameters: “name”, “description”, “callback function”, a parameters array, an input data array, an output data array and “where to render”. We use the callback function to calculate the values according to the logic of the custom indicator. The callback function has only one parameter: “context”. “context” is an object which has several properties, we will use the properties to get information from the WEB Trader and communicate with the trading platform.
registerIndicator("<Indicator's Name>", "<Description>", function (context) {} // callback function
...)
The parameters array declares what parameters will be set for the callback function. For example in this tutorial for Forex trading, we have two parameters, one is “period” and the other one is “shift”.
The input data array declares what input data will be transferred into the callback function every time the tick data trigger the callback function.
The output data array declares what output data will be transferred as the return values of the callback function every time the tick data trigger the callback function.
registerIndicator("<Indicator's Name>", "<Description>", function (context) {},
[{
    ...
},{
    ...
}],  // declare of an array for parameters
[{
    ...
},{
    ...
}],  // declare of an array for data input
[{
    ...
},{
    ...
}],  // declare of an array for data output
...)
For example in this tutorial for Forex trading, we use the “close” values of the candlesticks as the input data, and we map the input data to the “zero” index. Please refer to the source code below and see how to map the input data.
[{
	name: DATA_NAME.CLOSE, // We use 'close value' of the candlestick.
	index: 0
}],
We can not only specify the “close” values as our input data, but we can specify the “high” values or the “low” values or the “open” values of candlesticks as the input data to our callback function for calculating the output data.
After we map the input data to the index, we can get the “close” values of the candlesticks by using the “getDataInput” API. For example in this tutorial for Forex trading, we set “0” as the parameter of “getDataInput”.
The “getDataInput” function is another API of our SDK. Please check the source code below to know how to use the “getDataInput” API.
var dataInput = getDataInput(context, <Index of the Data Input>)
We define an array named “sma” as the output data.
[{
	name: "<Data Output's Name, in this case, the name is 'sma'>",
	visible: true,
	renderType: RENDER_TYPE.LINE,
	color: "steelblue"
}],
In the callback function, we use the “getDataOutput” API to transfer the values calculated to the WEB Trader as the return values, the WEB Trader will render the values on the chart after the values are transferred.
var dataOutput = getDataOutput(context, "<Indicator's Name>")
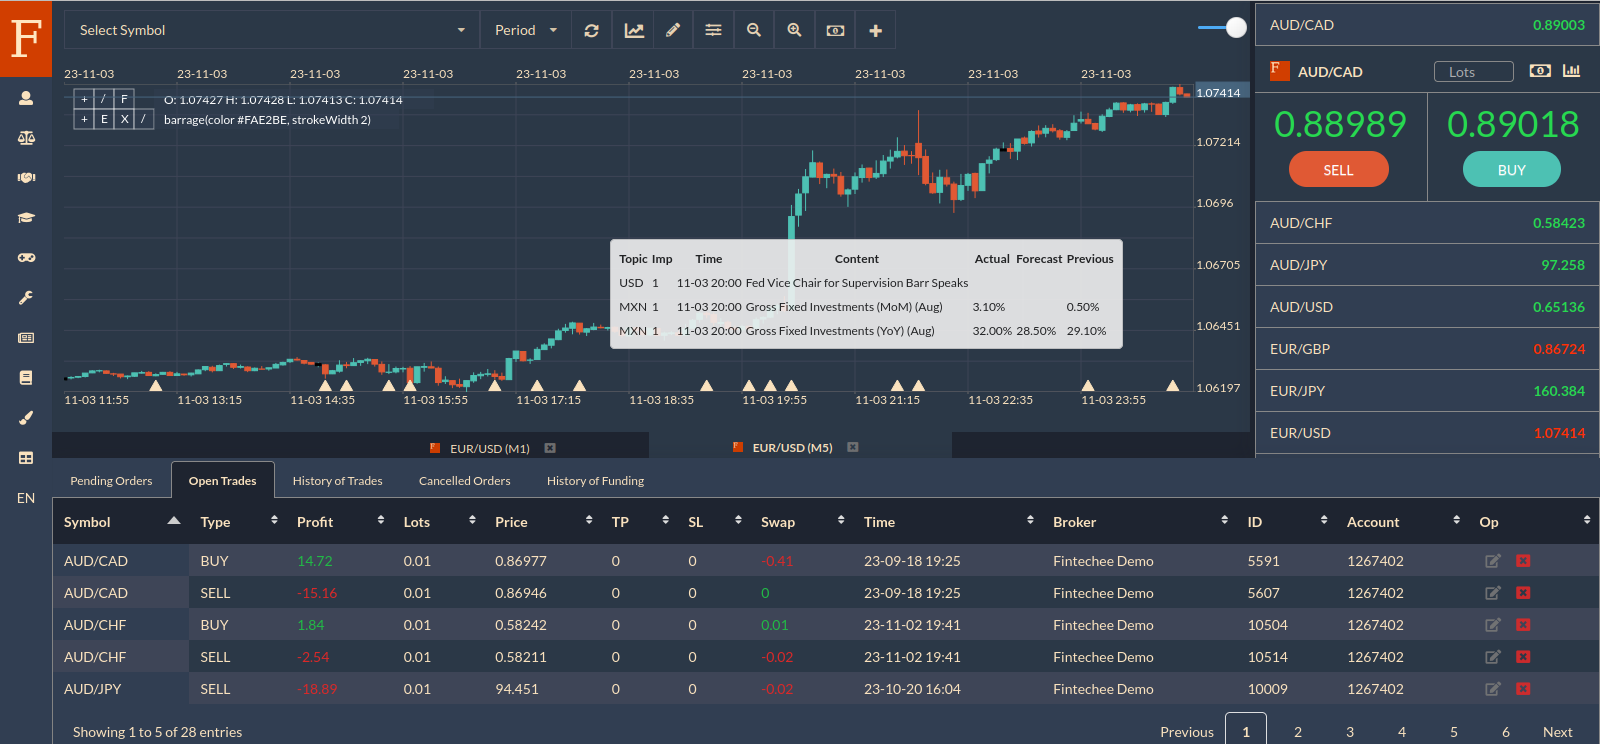
The parameter “where to render” specifies where to render the indicator. “WHERE_TO_RENDER.CHART_WINDOW” stands for this area which is the same as the main chart. “WHERE_TO_RENDER.SEPARATE_WINDOW” stands for this area separated from the main chart. We need to tell the WEB Trader how to render and where to render.
registerIndicator("<Indicator's Name>", "<Description>", function (context) {},
[{
    ...
},{
    ...
}],  // declare of an array for parameters
[{
    ...
},{
    ...
}],  // declare of an array for data input
[{
    ...
},{
    ...
}],  // declare of an array for data output
WHERE_TO_RENDER.CHART_WINDOW // This parameter specifies where to render. We have two options, one is to render on the main chart with the candlesticks, the other one is to render in separate window by using WHERE_TO_RENDER.SEPARATE_WINDOW
)
Now, it’s time to learn how to code a callback function. The callback function is where the main program logic of the custom indicator is.
We get the input data by the “getDataInput” API, get the output data by the “getDataOutput” API, get the indicator’s parameters by the “getIndiParameter” API, get the candlesticks array’s length by the “getCalculatedLength” API.
We use them in the callback function to calculate the moving average. If you want to shift the rendered MA line to the left, we need to set a negative value as the “shift” parameter. If we want to shift the rendered MA line to the right, we need to set a positive value as the “shift” parameter. The program logic that you need to code is much simpler than what you need to code in other trading platforms.
In this tutorial of Forex trading, we won’t discuss the APIs further. For more details regarding SDK trading, please check our other article: SDK Trading.
function (context) {
	var dataInput = getDataInput(context, <Index of the Data Input>)
	var dataOutput = getDataOutput(context, "<Indicator's Name>")
	var period = getIndiParameter(context, "<Parameter's Name, in this case, it's 'period'>")
	var shift = getIndiParameter(context, "<Parameter's Name, in this case, it's 'shift'>")

	var calculatedLength = getCalculatedLength(context)

	sma(dataInput, dataOutput, calculatedLength, period)

	if (shift != null && calculatedLength == 0) {
		setIndiShift(context, "<Data Output's Name, in this case, the name is 'sma'>", shift)
	}
}
After you code your own custom indicator, you can run it to register the indicator into the WEB Trader. What you need to do is just copy the source code and paste the source code into the console to run. After you run it, the indicator will be registered into the WEB Trader. Then you can add your own custom indicator to the specific chart.
The goal of this tutorial for Forex trading is to introduce how to code and use your own custom indicator. If you have any questions, please contact us.